01/dispatch · field note
Anatomy of the Cave
How the homelab map on this site was built — data-driven SVG, packets on wires, and what a diagram should never tell you.
2026-09·6 min read
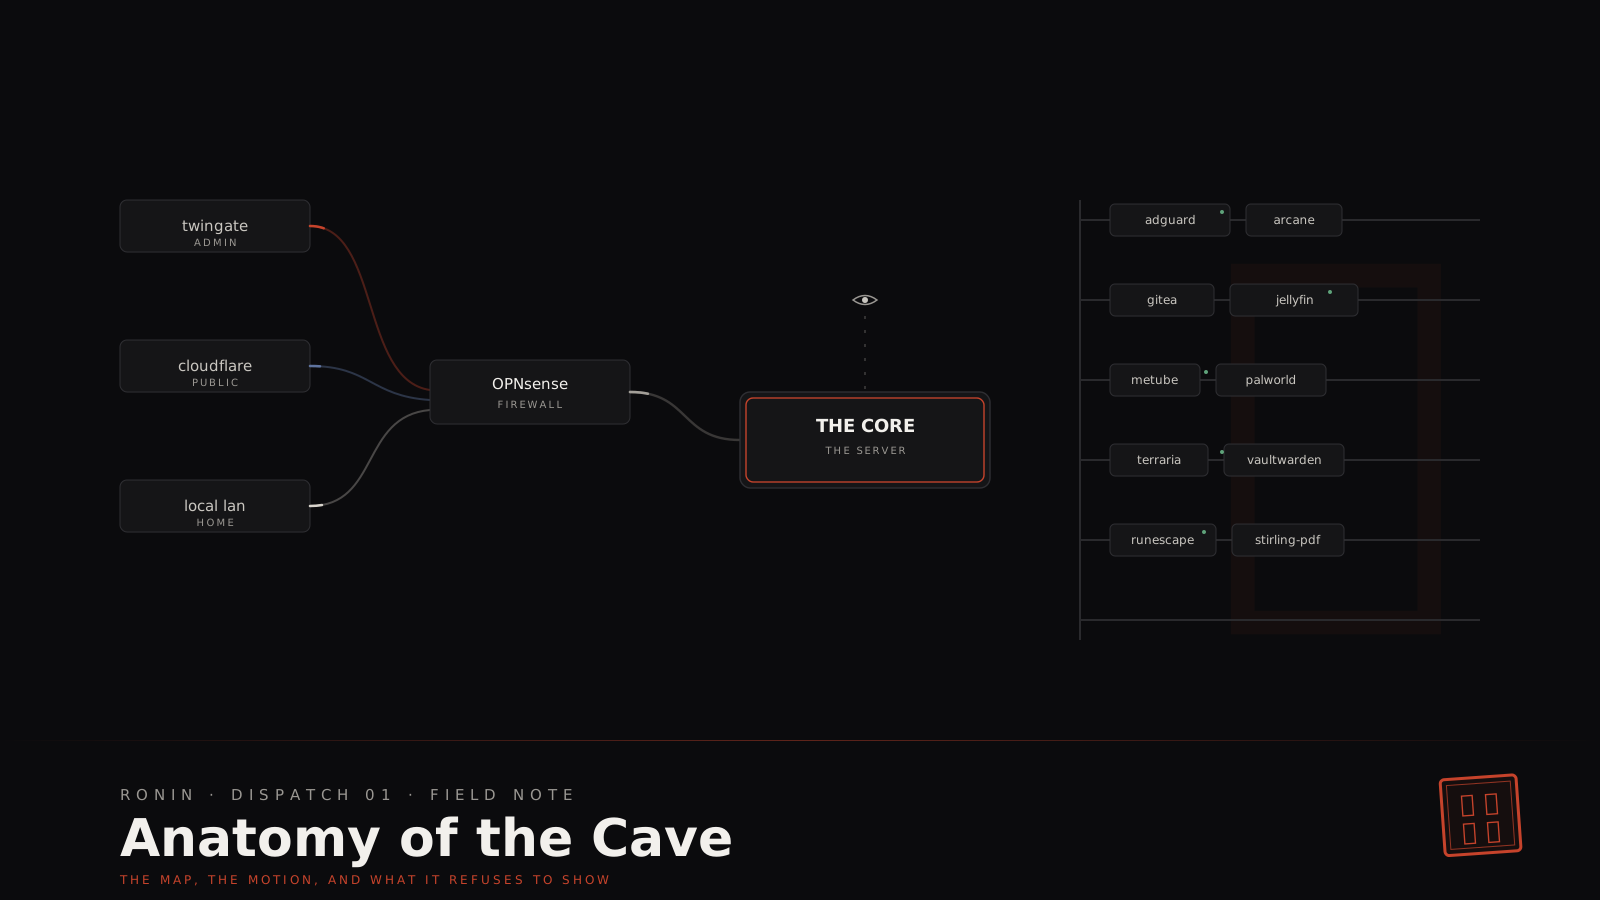
Every so often someone asks about the animated homelab map in The BOYS CAVE — how it's drawn, how it moves, and why it looks the way it does. This is that story. It's also the template every future dispatch on this site will follow, so I'm writing it the way I'd want to read it: the background, the decisions, the working code, and the parts I deliberately left out.
Why a diagram at all
Most homelab diagrams die in one of two ways. Either they're a screenshot of some diagramming tool that went stale six months ago, or they're so detailed — every VLAN, every IP, every version number — that they're a recon report with your name on it.
I wanted the opposite of both: a map that stays honest because it's cheap to update, and stays safe because it was never a secret in the first place. The map on the site is generated from a plain TypeScript file. If the lab changes, I change a few lines of data and the drawing, the animations, the tooltips, and the hover logic all follow. The diagram is code. Code gets maintained. Drawings get forgotten.
The data is the diagram
Every node, wire, and service chip on the map is one entry in a data file. The renderer never hardcodes so much as a coordinate — it reads the data and lays everything out:
{
  id: "core",
  label: "THE CORE",
  kind: "core",
  cx: 630, cy: 530, w: 230, h: 92,
  sub: "the server",
  tooltip: "The server. The cave everything else lives in — "
         + "storage, compute, and 19 reasons to keep patching.",
}
That's the heart of the whole thing. One object becomes a rounded rectangle with a label, a sub-label, a hover tooltip, and a spot in the related-node logic. An edge is the same idea with an SVG path and a style name; a service chip is a label plus a row number, and its width is computed from the label length so the bus packs itself.
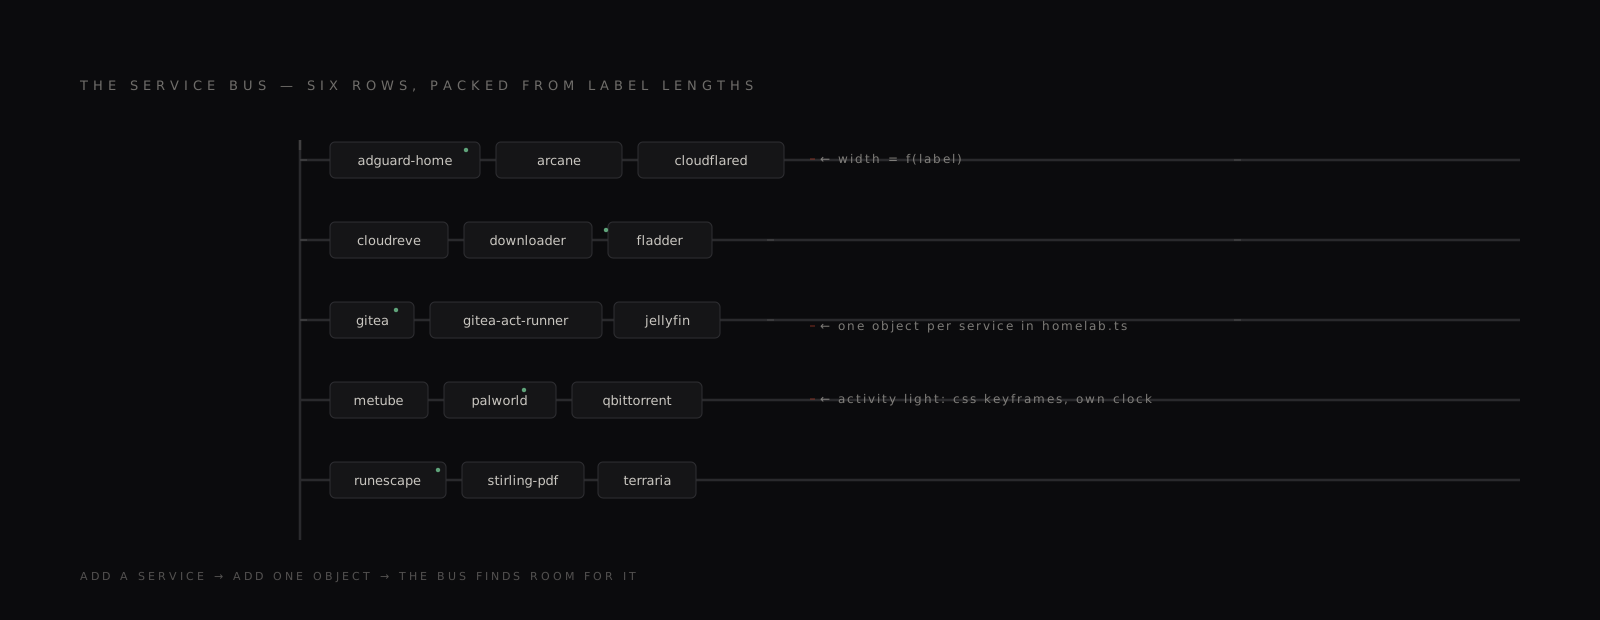
When I add a container to the lab, I add one object to the services array and the bus
finds room for it. When something gets banned — ask the government, not me — its node
gets a state: "disabled" flag and the renderer greys it out and draws the ban glyph
for free.
How the map stays alive
A static diagram feels like a corpse. The real network never stops moving, so neither should the drawing. Four layers of motion, each doing one job:
- Pulses on the wires. Every live edge carries a travelling dash pattern, driven by
a plain CSS
stroke-dashoffsetloop. Different edge types pulse at different speeds — the gaming mesh is fast and impatient, the admin path is slow and deliberate. - Packets. On top of the pulses, GSAP's MotionPathPlugin sends an actual glowing dot along each wire, each on its own clock so they never sync up. The SIEM line runs in reverse — logs flow up to the watcher, not down.
- Drift and breath. Every node bobs a few pixels on its own sine wave, the service chips' activity lights flicker like switch ports, and the core's inner ring breathes in vermillion — a heartbeat, slow enough to feel organic and fast enough to notice.
- The eye. The Wazuh node watches through a single eye glyph. The pupil wanders, the lid blinks, and it never stops. It's the one piece of the diagram visitors remember, which is correct, because observation is the whole point of a SIEM.
A slow radar sweep crosses the whole map every eleven seconds, and the entire SVG leans a few pixels toward your cursor — until you hover something, at which point it holds still, the way a map should when you're reading it.
What the map refuses to show
Here's the part that matters more than the animation. The map is deliberately generic, and it stays that way on purpose:
- No operating system or platform names for the core storage — the box is labeled THE CORE, full stop. Naming the distro tells an attacker exactly which CVE catalogue to bring.
- No versions, no hardware models, no addressing, no ports.
- No live status of any kind. The map is a static illustration. It never talks to the lab, and the lab never talks to it.
A public diagram should answer "what does this person understand about networking?" Never "where exactly should I aim?"
That line is the design brief for the whole section. The map proves competence; the data file proves maintenance; the animation proves care. None of it proves reachability.
Colophon, for the future dispatches
That's the loop. Break something interesting, write it down, stamp it with the seal, ship it. 必殺.